August 17, 2015 - GALLUP
Americans' Support for Labor Unions Continues to Recover
by Lydia Saad
Story Highlights
- Nearly six in 10 now approve of unions, up from 48% in 2009
- Slightly more want union influence to strengthen than weaken
- Majority believe unions are getting weaker
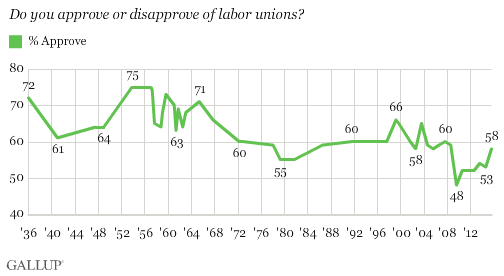
PRINCETON, N.J. -- Americans' approval of labor unions has jumped five percentage points to 58% over the past year, and is now at its highest point since 2008, when 59% approved. In the interim, the image of organized labor had suffered, sinking to an all-time low of 48% in 2009.
Gallup first asked Americans about organized labor in 1936, a year after Congress legalized private-sector unions and collective bargaining. At that time, 72% of Americans approved of unions. Support remained high into the 1960s, but then dipped through the 1970s until it reached 55% in 1979. It has since varied, reaching as high as 66% in 1999 and as low as the 48% in 2009.
The latest results are from the 2015 installment of Gallup's annual Work and Education survey, conducted Aug. 5-9.
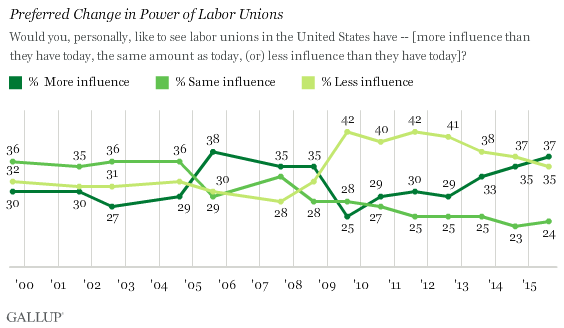
Consistent with the recent increase in approval of unions, the percentage of Americans saying they would like labor unions to have more influence in the country has also been rising, and now stands at 37%, up from 25% in 2009. Meanwhile, the percentage wanting unions to have less influence has declined from 42% to 35%, although it remains higher than it was from 1999 through 2008. Instead, fewer today say they want unions' influence to stay the same.
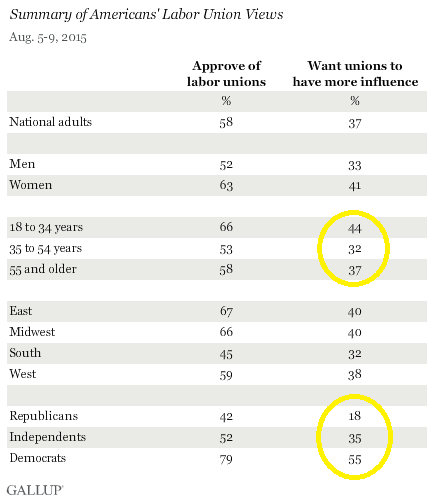
There are a few interesting demographic differences. For example, on both questions, support for unions is higher among women than men. Specifically, 63% of women compared with 52% of men approve of labor unions. Also 41% of women vs. 33% of men want unions to have more influence. Favorable views of unions are significantly higher in the East, Midwest and West than in the South. In fact, the South is the only region where less than half of residents approve of unions. Perhaps most positive for the future of unions is the finding that young adults, those aged 18 to 34, are the most supportive of all age groups.
In terms of politics, Democrats are the most supportive of unions, with 79% approving and 55% wanting unions to have more influence. While close to half of Republicans approve of unions, just 18% want them to have more influence -- 53% want them to have less. The views of independents fall a little closer to Republicans' than Democrats' on both questions.
Americans Perceive Union Power Is Waning
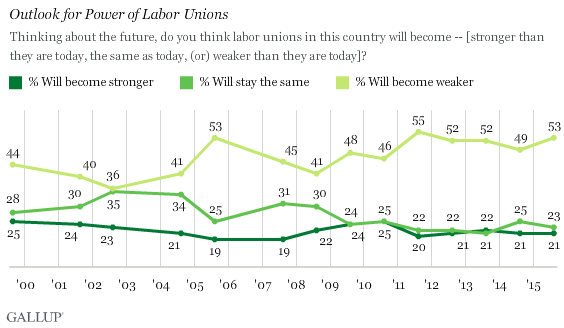
Although Americans have become more pro-union, their perceptions of the outlook for union power haven't changed in the past few years. Fifty-three percent believe unions will be weaker in the future, similar to the result each year since 2011. In most years prior to that, between 41% and 48% thought union power would dwindle, while a higher percentage than today thought it would stay the same.
Who Belongs?
Approximately one in eight working adults in the U.S. (12%) belong to a labor union, equivalent to 8% of all Americans. More broadly, 17% of Americans live in a household where at least one person belongs to a union. But, notably, this varies markedly by region, with just 6% of adults in the South living in a union household, compared with 18% in the West and roughly a quarter in the East (24%) and Midwest (23%). Membership is also higher among nonwhites (24%) than whites (13%), and among Democrats (24%) than Republicans and independents (13% each). There are smaller differences by gender, and almost none by age.
Bottom Line
With the economy continuing to do better than it did during the recession and the 2008 government bailout of two of the Big Three American auto companies -- for which unions' image may have suffered -- fading further into history, Americans' views of unions are largely restored to what they were six years ago. The solid majority approve of unions, and most would like to see unions' power maintained if not strengthened.
Survey Methods
Results for this Gallup poll are based on telephone interviews conducted Aug. 5-9, 2015, with a random sample of 1,011 adults, aged 18 and older, living in all 50 U.S. states and the District of Columbia. For results based on the total sample of national adults, the margin of sampling error is ±4 percentage points at the 95% confidence level. All reported margins of sampling error include computed design effects for weighting.
Each sample of national adults includes a minimum quota of 50% cellphone respondents and 50% landline respondents, with additional minimum quotas by time zone within region. Landline and cellular telephone numbers are selected using random-digit-dial methods.


